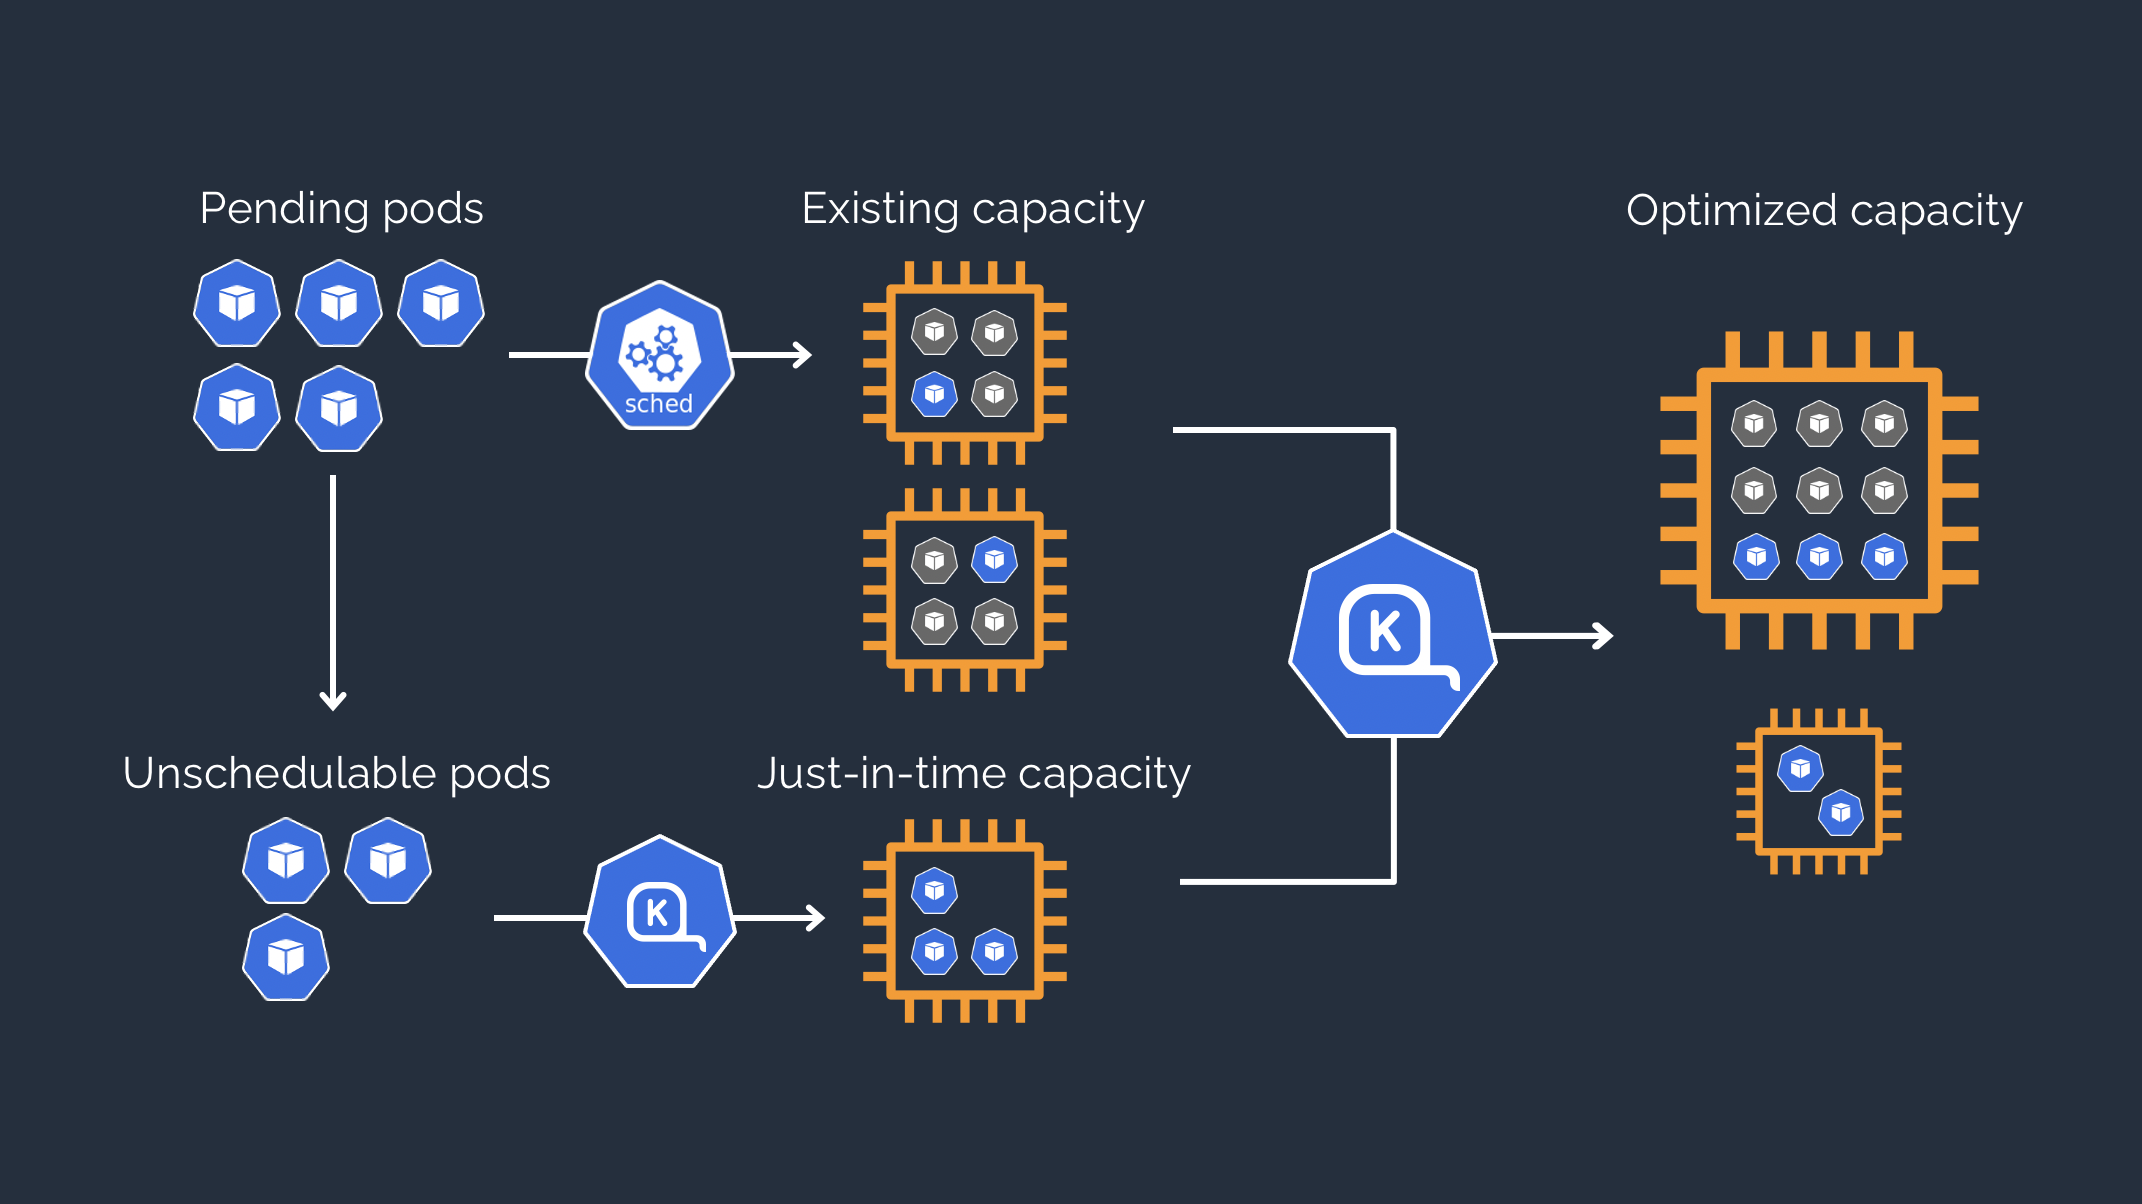
In the previous post, Boost Your EKS Efficiency: Migrating from Cluster-Autoscaler to Karpenter, we added Karpenter to our AWS EKS reachable by private VPN and created via Terraform.
We can then deploy our applications and scale them in the most appropriate way.
However, we also need to be able to monitor our applications and the infrastructure they use.
But what is the fastest and most efficient way to monitor a Kubernetes cluster and its nodes, both Linux and Windows?
There is a stack called kube-prometheus that was created specifically to provide a ready-made and complete solution that includes everything needed to monitor your Kubernetes cluster.
In this way, in one go we install not only Prometheus, Grafana and also other necessary software such as the exporter for Windows nodes, but we already have all the configurations, dashboards and alarms ready, prepared by a specialized community.
In this post we will see how to install kube-prometheus on our test infrastructure via Terraform in the fastest way to be ready to monitor our microservices.


